#include <gnuplot_i.hpp>
 Collaboration diagram for gnuplot::Gnuplot:
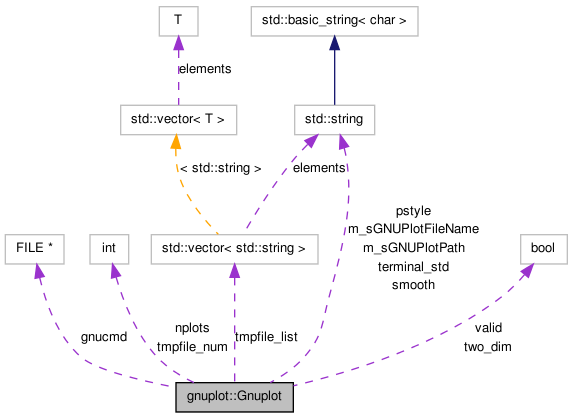
Public Member Functions | |
| Gnuplot & | cmd (const std::string &cmdstr) |
| send a command to gnuplot | |
| Gnuplot (const std::vector< float > &x, const std::string &title="", const std::string &style="points", const std::string &labelx="x", const std::string &labely="y") | |
| plot a single std::vector at one go | |
| Gnuplot (const std::vector< float > &x, const std::vector< float > &y, const std::vector< float > &z, const std::string &title="", const std::string &style="points", const std::string &labelx="x", const std::string &labely="y", const std::string &labelz="z") | |
| plot triples std::vector at one go | |
| Gnuplot (const std::string &style="points") | |
| set a style during construction | |
| Gnuplot (const std::vector< float > &x, const std::vector< float > &y, const std::string &title="", const std::string &style="points", const std::string &labelx="x", const std::string &labely="y") | |
| plot pairs std::vector at one go | |
| bool | is_valid () |
| Is the gnuplot session valid ?? | |
| Gnuplot & | operator<< (const std::string &cmdstr) |
| Sends a command to an active gnuplot session, identical to cmd() send a command to gnuplot using the << operator. | |
| Gnuplot & | plot_equation (const std::string &equation, const std::string &title="") |
| plot an equation supplied as a std::string y=f(x), write only the function f(x) not y the independent variable has to be x binary operators: ** exponentiation, * multiply, / divide, + add, - substract, % modulo unary operators: - minus, ! factorial elementary functions: rand(x), abs(x), sgn(x), ceil(x), floor(x), int(x), imag(x), real(x), arg(x), sqrt(x), exp(x), log(x), log10(x), sin(x), cos(x), tan(x), asin(x), acos(x), atan(x), atan2(y,x), sinh(x), cosh(x), tanh(x), asinh(x), acosh(x), atanh(x) special functions: erf(x), erfc(x), inverf(x), gamma(x), igamma(a,x), lgamma(x), ibeta(p,q,x), besj0(x), besj1(x), besy0(x), besy1(x), lambertw(x) statistical fuctions: norm(x), invnorm(x) | |
| Gnuplot & | plot_equation3d (const std::string &equation, const std::string &title="") |
| plot an equation supplied as a std::string z=f(x,y), write only the function f(x,y) not z the independent variables have to be x and y | |
| Gnuplot & | plot_image (const unsigned char *ucPicBuf, const unsigned int iWidth, const unsigned int iHeight, const std::string &title="") |
| plot image | |
| Gnuplot & | plot_slope (const float a, const float b, const std::string &title="") |
| plot an equation of the form: y = ax + b, you supply a and b | |
| template<typename X > | |
| Gnuplot & | plot_x (const X &x, const std::string &title="") |
| from std::vector | |
| template<typename X , typename Y > | |
| Gnuplot & | plot_xy (const X &x, const Y &y, const std::string &title="") |
| from data | |
| template<typename X , typename Y , typename E > | |
| Gnuplot & | plot_xy_err (const X &x, const Y &y, const E &dy, const std::string &title="") |
| from data | |
| template<typename X , typename Y , typename Z > | |
| Gnuplot & | plot_xyz (const X &x, const Y &y, const Z &z, const std::string &title="") |
| from std::vector | |
| Gnuplot & | plotfile_x (const std::string &filename, const unsigned int column=1, const std::string &title="") |
| plot a single std::vector: x from file | |
| Gnuplot & | plotfile_xy (const std::string &filename, const unsigned int column_x=1, const unsigned int column_y=2, const std::string &title="") |
| plot x,y pairs: x y from file | |
| Gnuplot & | plotfile_xy_err (const std::string &filename, const unsigned int column_x=1, const unsigned int column_y=2, const unsigned int column_dy=3, const std::string &title="") |
| plot x,y pairs with dy errorbars: x y dy from file | |
| Gnuplot & | plotfile_xyz (const std::string &filename, const unsigned int column_x=1, const unsigned int column_y=2, const unsigned int column_z=3, const std::string &title="") |
| plot x,y,z triples: x y z from file | |
| void | remove_tmpfiles () |
| deletes temporary files | |
| Gnuplot & | replot (void) |
| replot repeats the last plot or splot command. | |
| Gnuplot & | reset_all () |
| resets a gnuplot session and sets all variables to default | |
| Gnuplot & | reset_plot () |
| resets a gnuplot session (next plot will erase previous ones) | |
| Gnuplot & | savetofigure (const std::string filename, const std::string terminal="ps") |
| Saves a gnuplot to a file named filename. Defaults to saving pdf. | |
| Gnuplot & | set_cbrange (const float iFrom, const float iTo) |
| set palette range (autoscale by default) | |
| Gnuplot & | set_contour (const std::string &position="base") |
| enables/disables contour drawing for surfaces (for 3d plot) base, surface, both | |
| Gnuplot & | set_grid () |
| turns grid on/off | |
| Gnuplot & | set_hidden3d () |
| enables/disables hidden line removal for surface plotting (for 3d plot) | |
| Gnuplot & | set_isosamples (const int isolines=10) |
| set isoline density (grid) for plotting functions as surfaces (for 3d plots) | |
| Gnuplot & | set_legend (const std::string &position="default") |
| switches legend on/off position: inside/outside, left/center/right, top/center/bottom, nobox/box | |
| Gnuplot & | set_multiplot () |
| set the mulitplot mode | |
| Gnuplot & | set_pointsize (const float pointsize=1.0) |
| scales the size of the points used in plots | |
| Gnuplot & | set_samples (const int samples=100) |
| set sampling rate of functions, or for interpolating data | |
| Gnuplot & | set_smooth (const std::string &stylestr="csplines") |
| interpolation and approximation of data, arguments: csplines, bezier, acsplines (for data values > 0), sbezier, unique, frequency (works only with plot_x, plot_xy, plotfile_x, plotfile_xy (if smooth is set, set_style has no effekt on data plotting) | |
| Gnuplot & | set_style (const std::string &stylestr="points") |
| set line style (some of these styles require additional information): lines, points, linespoints, impulses, dots, steps, fsteps, histeps, boxes, histograms, filledcurves | |
| Gnuplot & | set_surface () |
| enables/disables the display of surfaces (for 3d plot) | |
| Gnuplot & | set_title (const std::string &title="") |
| sets and clears the title of a gnuplot session | |
| Gnuplot & | set_xautoscale () |
| autoscale axis (set by default) of xaxis | |
| Gnuplot & | set_xlabel (const std::string &label="y") |
| set y axis label | |
| Gnuplot & | set_xlogscale (const float base=10) |
| turns on/off log scaling for the specified xaxis (logscale is not set by default) | |
| Gnuplot & | set_xrange (const float iFrom, const float iTo) |
| set axis - ranges | |
| Gnuplot & | set_yautoscale () |
| autoscale axis (set by default) of yaxis | |
| Gnuplot & | set_ylabel (const std::string &label="x") |
| set x axis label | |
| Gnuplot & | set_ylogscale (const float base=10) |
| turns on/off log scaling for the specified yaxis (logscale is not set by default) | |
| Gnuplot & | set_yrange (const float iFrom, const float iTo) |
| set y-axis - ranges | |
| Gnuplot & | set_zautoscale () |
| autoscale axis (set by default) of zaxis | |
| Gnuplot & | set_zlabel (const std::string &label="z") |
| set z axis label | |
| Gnuplot & | set_zlogscale (const float base=10) |
| turns on/off log scaling for the specified zaxis (logscale is not set by default) | |
| Gnuplot & | set_zrange (const float iFrom, const float iTo) |
| set z-axis - ranges | |
| Gnuplot & | showonscreen () |
| sets terminal type to terminal_std | |
| Gnuplot & | unset_contour () |
| contour is not set by default, it disables contour drawing for surfaces | |
| Gnuplot & | unset_grid () |
| grid is not set by default | |
| Gnuplot & | unset_hidden3d () |
| hidden3d is not set by default | |
| Gnuplot & | unset_legend () |
| Switches legend off attention:legend is set by default. | |
| Gnuplot & | unset_multiplot () |
| unsets the mulitplot mode | |
| Gnuplot & | unset_smooth () |
| unset smooth attention: smooth is not set by default | |
| Gnuplot & | unset_surface () |
| surface is set by default, it disables the display of surfaces (for 3d plot) | |
| Gnuplot & | unset_title () |
| Clears the title of a gnuplot session The title is not set by default. | |
| Gnuplot & | unset_xlogscale () |
| turns off log scaling for the x axis | |
| Gnuplot & | unset_ylogscale () |
| turns off log scaling for the y axis | |
| Gnuplot & | unset_zlogscale () |
| turns off log scaling for the z axis | |
| ~Gnuplot () | |
| destructor: needed to delete temporary files | |
Static Public Member Functions | |
| static bool | set_GNUPlotPath (const std::string &path) |
| optional function: set Gnuplot path manual attention: for windows: path with slash '/' not backslash '\' | |
| static void | set_terminal_std (const std::string &type) |
| optional: set standart terminal, used by showonscreen defaults: Windows - win, Linux - x11, Mac - aqua | |
Private Member Functions | |
| std::string | create_tmpfile (std::ofstream &tmp) |
| creates tmpfile and returns its name | |
| bool | file_available (const std::string &filename) |
| checks if file is available | |
| void | init () |
| get_program_path(); and popen(); | |
Static Private Member Functions | |
| static bool | file_exists (const std::string &filename, int mode=0) |
| checks if file exists | |
| static bool | get_program_path () |
| gnuplot path found? | |
Private Attributes | |
| FILE * | gnucmd |
| pointer to the stream that can be used to write to the pipe | |
| int | nplots |
| number of plots in session | |
| std::string | pstyle |
| functions and data are displayed in a defined styles | |
| std::string | smooth |
| interpolate and approximate data in defined styles (e.g. spline) | |
| std::vector< std::string > | tmpfile_list |
| list of created tmpfiles | |
| bool | two_dim |
| true = 2d, false = 3d | |
| bool | valid |
| validation of gnuplot session | |
Static Private Attributes | |
| static std::string | m_sGNUPlotFileName |
| name of executed GNUPlot file | |
| static std::string | m_sGNUPlotPath |
| gnuplot path | |
| static std::string | terminal_std |
| standart terminal, used by showonscreen | |
| static int | tmpfile_num = 0 |
| number of all tmpfiles (number of tmpfiles restricted) | |
Constructor & Destructor Documentation
| Gnuplot::Gnuplot | ( | const std::string & | style = "points" |
) |
set a style during construction
References init(), and set_style().
| Gnuplot::Gnuplot | ( | const std::vector< float > & | x, | |
| const std::string & | title = "", |
|||
| const std::string & | style = "points", |
|||
| const std::string & | labelx = "x", |
|||
| const std::string & | labely = "y" | |||
| ) |
plot a single std::vector at one go
References init(), plot_x(), set_style(), set_xlabel(), and set_ylabel().
| Gnuplot::Gnuplot | ( | const std::vector< float > & | x, | |
| const std::vector< float > & | y, | |||
| const std::string & | title = "", |
|||
| const std::string & | style = "points", |
|||
| const std::string & | labelx = "x", |
|||
| const std::string & | labely = "y" | |||
| ) |
plot pairs std::vector at one go
References init(), plot_xy(), set_style(), set_xlabel(), and set_ylabel().
| Gnuplot::Gnuplot | ( | const std::vector< float > & | x, | |
| const std::vector< float > & | y, | |||
| const std::vector< float > & | z, | |||
| const std::string & | title = "", |
|||
| const std::string & | style = "points", |
|||
| const std::string & | labelx = "x", |
|||
| const std::string & | labely = "y", |
|||
| const std::string & | labelz = "z" | |||
| ) |
plot triples std::vector at one go
References init(), plot_xyz(), set_style(), set_xlabel(), set_ylabel(), and set_zlabel().
| Gnuplot::~Gnuplot | ( | ) |
destructor: needed to delete temporary files
References gnucmd.
Member Function Documentation
| Gnuplot & Gnuplot::cmd | ( | const std::string & | cmdstr | ) |
send a command to gnuplot
References gnucmd, nplots, two_dim, and valid.
Referenced by tracking::Accum_sofq_ND::display(), operator<<(), plot_equation(), plot_equation3d(), plot_image(), plot_slope(), plotfile_x(), plotfile_xy(), plotfile_xy_err(), plotfile_xyz(), replot(), reset_all(), savetofigure(), set_cbrange(), set_contour(), set_grid(), set_hidden3d(), set_isosamples(), set_legend(), set_multiplot(), set_pointsize(), set_samples(), set_surface(), set_xautoscale(), set_xlabel(), set_xlogscale(), set_xrange(), set_yautoscale(), set_ylabel(), set_ylogscale(), set_yrange(), set_zautoscale(), set_zlabel(), set_zlogscale(), set_zrange(), showonscreen(), unset_contour(), unset_grid(), unset_hidden3d(), unset_legend(), unset_multiplot(), unset_surface(), unset_xlogscale(), unset_ylogscale(), and unset_zlogscale().
| std::string Gnuplot::create_tmpfile | ( | std::ofstream & | tmp | ) | [private] |
creates tmpfile and returns its name
- Parameters:
-
tmp --> points to the tempfile
- Returns:
- <-- the name of the tempfile
References tmpfile_list, and tmpfile_num.
Referenced by plot_image(), plot_x(), plot_xy(), plot_xy_err(), and plot_xyz().
| bool Gnuplot::file_available | ( | const std::string & | filename | ) | [private] |
checks if file is available
- Parameters:
-
filename --> the filename
- Returns:
- file exists (yes == true, no == false)
References file_exists().
Referenced by plotfile_x(), plotfile_xy(), plotfile_xy_err(), and plotfile_xyz().
| bool Gnuplot::file_exists | ( | const std::string & | filename, | |
| int | mode = 0 | |||
| ) | [static, private] |
checks if file exists
- Parameters:
-
filename --> the filename mode --> the mode [optional,default value = 0]
- Returns:
- file exists (yes == true, no == false)
Referenced by file_available(), get_program_path(), and set_GNUPlotPath().
| bool Gnuplot::get_program_path | ( | ) | [static, private] |
gnuplot path found?
- Parameters:
-
---
- Returns:
- <-- found the gnuplot path (yes == true, no == false)
References file_exists(), m_sGNUPlotFileName, m_sGNUPlotPath, and stringtok().
Referenced by init().
| void Gnuplot::init | ( | ) | [private] |
get_program_path(); and popen();
- Parameters:
-
--> void
- Returns:
- <-- void
References get_program_path(), gnucmd, m_sGNUPlotFileName, m_sGNUPlotPath, nplots, showonscreen(), smooth, and valid.
Referenced by Gnuplot().
| bool gnuplot::Gnuplot::is_valid | ( | ) | [inline] |
Is the gnuplot session valid ??
- Parameters:
-
---
- Returns:
- true if valid, false if not
References valid.
| Gnuplot& gnuplot::Gnuplot::operator<< | ( | const std::string & | cmdstr | ) | [inline] |
| Gnuplot & Gnuplot::plot_equation | ( | const std::string & | equation, | |
| const std::string & | title = "" | |||
| ) |
plot an equation supplied as a std::string y=f(x), write only the function f(x) not y the independent variable has to be x binary operators: ** exponentiation, * multiply, / divide, + add, - substract, % modulo unary operators: - minus, ! factorial elementary functions: rand(x), abs(x), sgn(x), ceil(x), floor(x), int(x), imag(x), real(x), arg(x), sqrt(x), exp(x), log(x), log10(x), sin(x), cos(x), tan(x), asin(x), acos(x), atan(x), atan2(y,x), sinh(x), cosh(x), tanh(x), asinh(x), acosh(x), atanh(x) special functions: erf(x), erfc(x), inverf(x), gamma(x), igamma(a,x), lgamma(x), ibeta(p,q,x), besj0(x), besj1(x), besy0(x), besy1(x), lambertw(x) statistical fuctions: norm(x), invnorm(x)
| Gnuplot & Gnuplot::plot_equation3d | ( | const std::string & | equation, | |
| const std::string & | title = "" | |||
| ) |
| Gnuplot & Gnuplot::plot_image | ( | const unsigned char * | ucPicBuf, | |
| const unsigned int | iWidth, | |||
| const unsigned int | iHeight, | |||
| const std::string & | title = "" | |||
| ) |
plot image
* note that this function is not valid for versions of GNUPlot below 4.2
References cmd(), create_tmpfile(), nplots, and two_dim.
Referenced by tracking::Accum_sofq_ND::display().
| Gnuplot & Gnuplot::plot_slope | ( | const float | a, | |
| const float | b, | |||
| const std::string & | title = "" | |||
| ) |
| Gnuplot & Gnuplot::plot_x | ( | const X & | x, | |
| const std::string & | title = "" | |||
| ) |
from std::vector
Plots a 2d graph from a list of floats: x.
References create_tmpfile(), and plotfile_x().
Referenced by Gnuplot().
| Gnuplot & Gnuplot::plot_xy | ( | const X & | x, | |
| const Y & | y, | |||
| const std::string & | title = "" | |||
| ) |
from data
Plots a 2d graph from a list of floats: x y.
References create_tmpfile(), and plotfile_xy().
Referenced by Gnuplot().
| Gnuplot & Gnuplot::plot_xy_err | ( | const X & | x, | |
| const Y & | y, | |||
| const E & | dy, | |||
| const std::string & | title = "" | |||
| ) |
from data
-----------------------------------------------------------------------------
plot x,y pairs with dy errorbars
References create_tmpfile(), and plotfile_xy_err().
| Gnuplot & Gnuplot::plot_xyz | ( | const X & | x, | |
| const Y & | y, | |||
| const Z & | z, | |||
| const std::string & | title = "" | |||
| ) |
| Gnuplot & Gnuplot::plotfile_x | ( | const std::string & | filename, | |
| const unsigned int | column = 1, |
|||
| const std::string & | title = "" | |||
| ) |
| Gnuplot & Gnuplot::plotfile_xy | ( | const std::string & | filename, | |
| const unsigned int | column_x = 1, |
|||
| const unsigned int | column_y = 2, |
|||
| const std::string & | title = "" | |||
| ) |
| Gnuplot & Gnuplot::plotfile_xy_err | ( | const std::string & | filename, | |
| const unsigned int | column_x = 1, |
|||
| const unsigned int | column_y = 2, |
|||
| const unsigned int | column_dy = 3, |
|||
| const std::string & | title = "" | |||
| ) |
plot x,y pairs with dy errorbars: x y dy from file
References cmd(), file_available(), nplots, and two_dim.
Referenced by plot_xy_err().
| Gnuplot & Gnuplot::plotfile_xyz | ( | const std::string & | filename, | |
| const unsigned int | column_x = 1, |
|||
| const unsigned int | column_y = 2, |
|||
| const unsigned int | column_z = 3, |
|||
| const std::string & | title = "" | |||
| ) |
plot x,y,z triples: x y z from file
References cmd(), file_available(), nplots, pstyle, and two_dim.
Referenced by plot_xyz().
| void Gnuplot::remove_tmpfiles | ( | ) |
deletes temporary files
References tmpfile_list, and tmpfile_num.
Referenced by tracking::Accum_sofq_ND::display(), and tracking::Track_box::plot_intensity().
| Gnuplot& gnuplot::Gnuplot::replot | ( | void | ) | [inline] |
replot repeats the last plot or splot command.
this can be useful for viewing a plot with different set options, or when generating the same plot for several devices (showonscreen,
- Parameters:
-
---
- Returns:
- ---
Referenced by tracking::Accum_sofq::display(), and tracking::Track_box::plot_intensity().
| Gnuplot & Gnuplot::reset_all | ( | ) |
resets a gnuplot session and sets all variables to default
References cmd(), nplots, pstyle, showonscreen(), and smooth.
| Gnuplot & Gnuplot::reset_plot | ( | ) |
resets a gnuplot session (next plot will erase previous ones)
References nplots.
| Gnuplot & Gnuplot::savetofigure | ( | const std::string | filename, | |
| const std::string | terminal = "ps" | |||
| ) |
Saves a gnuplot to a file named filename. Defaults to saving pdf.
References cmd().
| Gnuplot & Gnuplot::set_cbrange | ( | const float | iFrom, | |
| const float | iTo | |||
| ) |
set palette range (autoscale by default)
References cmd().
Referenced by tracking::Accum_sofq_ND::display().
| Gnuplot & Gnuplot::set_contour | ( | const std::string & | position = "base" |
) |
enables/disables contour drawing for surfaces (for 3d plot) base, surface, both
References cmd().
| bool Gnuplot::set_GNUPlotPath | ( | const std::string & | path | ) | [static] |
optional function: set Gnuplot path manual attention: for windows: path with slash '/' not backslash '\'
- Parameters:
-
path --> the gnuplot path
- Returns:
- true on success, false otherwise
References file_exists(), m_sGNUPlotFileName, and m_sGNUPlotPath.
| Gnuplot& gnuplot::Gnuplot::set_grid | ( | ) | [inline] |
turns grid on/off
References cmd().
Referenced by tracking::Corr_gofr::display(), tracking::Accum_sofq::display(), utilities::Accum_case::display(), and tracking::Track_box::plot_intensity().
| Gnuplot& gnuplot::Gnuplot::set_hidden3d | ( | ) | [inline] |
enables/disables hidden line removal for surface plotting (for 3d plot)
- Parameters:
-
---
- Returns:
- <-- reference to the gnuplot object
References cmd().
| Gnuplot & Gnuplot::set_isosamples | ( | const int | isolines = 10 |
) |
set isoline density (grid) for plotting functions as surfaces (for 3d plots)
References cmd().
| Gnuplot & Gnuplot::set_legend | ( | const std::string & | position = "default" |
) |
switches legend on/off position: inside/outside, left/center/right, top/center/bottom, nobox/box
References cmd().
| Gnuplot& gnuplot::Gnuplot::set_multiplot | ( | ) | [inline] |
set the mulitplot mode
- Parameters:
-
---
- Returns:
- <-- reference to the gnuplot object
References cmd().
| Gnuplot & Gnuplot::set_pointsize | ( | const float | pointsize = 1.0 |
) |
scales the size of the points used in plots
References cmd().
| Gnuplot & Gnuplot::set_samples | ( | const int | samples = 100 |
) |
set sampling rate of functions, or for interpolating data
References cmd().
| Gnuplot & Gnuplot::set_smooth | ( | const std::string & | stylestr = "csplines" |
) |
interpolation and approximation of data, arguments: csplines, bezier, acsplines (for data values > 0), sbezier, unique, frequency (works only with plot_x, plot_xy, plotfile_x, plotfile_xy (if smooth is set, set_style has no effekt on data plotting)
References smooth.
| Gnuplot & Gnuplot::set_style | ( | const std::string & | stylestr = "points" |
) |
| Gnuplot& gnuplot::Gnuplot::set_surface | ( | ) | [inline] |
enables/disables the display of surfaces (for 3d plot)
- Parameters:
-
---
- Returns:
- <-- reference to the gnuplot object
References cmd().
| void Gnuplot::set_terminal_std | ( | const std::string & | type | ) | [static] |
optional: set standart terminal, used by showonscreen defaults: Windows - win, Linux - x11, Mac - aqua
- Parameters:
-
type --> the terminal type
- Returns:
- ---
References terminal_std.
| Gnuplot& gnuplot::Gnuplot::set_title | ( | const std::string & | title = "" |
) | [inline] |
sets and clears the title of a gnuplot session
- Parameters:
-
title --> the title of the plot [optional, default == ""]
- Returns:
- <-- reference to the gnuplot object
Referenced by unset_title().
| Gnuplot& gnuplot::Gnuplot::set_xautoscale | ( | ) | [inline] |
autoscale axis (set by default) of xaxis
- Parameters:
-
---
- Returns:
- <-- reference to the gnuplot object
References cmd().
| Gnuplot & Gnuplot::set_xlabel | ( | const std::string & | label = "y" |
) |
| Gnuplot & Gnuplot::set_xlogscale | ( | const float | base = 10 |
) |
turns on/off log scaling for the specified xaxis (logscale is not set by default)
References cmd().
| Gnuplot & Gnuplot::set_xrange | ( | const float | iFrom, | |
| const float | iTo | |||
| ) |
| Gnuplot& gnuplot::Gnuplot::set_yautoscale | ( | ) | [inline] |
autoscale axis (set by default) of yaxis
- Parameters:
-
---
- Returns:
- <-- reference to the gnuplot object
References cmd().
| Gnuplot & Gnuplot::set_ylabel | ( | const std::string & | label = "x" |
) |
| Gnuplot & Gnuplot::set_ylogscale | ( | const float | base = 10 |
) |
turns on/off log scaling for the specified yaxis (logscale is not set by default)
References cmd().
| Gnuplot & Gnuplot::set_yrange | ( | const float | iFrom, | |
| const float | iTo | |||
| ) |
| Gnuplot& gnuplot::Gnuplot::set_zautoscale | ( | ) | [inline] |
autoscale axis (set by default) of zaxis
- Parameters:
-
---
- Returns:
- <-- reference to the gnuplot object
References cmd().
| Gnuplot & Gnuplot::set_zlabel | ( | const std::string & | label = "z" |
) |
| Gnuplot & Gnuplot::set_zlogscale | ( | const float | base = 10 |
) |
turns on/off log scaling for the specified zaxis (logscale is not set by default)
References cmd().
| Gnuplot & Gnuplot::set_zrange | ( | const float | iFrom, | |
| const float | iTo | |||
| ) |
set z-axis - ranges
References cmd().
| Gnuplot & Gnuplot::showonscreen | ( | ) |
sets terminal type to terminal_std
References cmd(), and terminal_std.
Referenced by init(), and reset_all().
| Gnuplot& gnuplot::Gnuplot::unset_contour | ( | ) | [inline] |
contour is not set by default, it disables contour drawing for surfaces
- Parameters:
-
---
- Returns:
- <-- reference to the gnuplot object
References cmd().
| Gnuplot& gnuplot::Gnuplot::unset_hidden3d | ( | ) | [inline] |
hidden3d is not set by default
- Parameters:
-
---
- Returns:
- <-- reference to the gnuplot object
References cmd().
| Gnuplot& gnuplot::Gnuplot::unset_legend | ( | ) | [inline] |
Switches legend off attention:legend is set by default.
- Parameters:
-
---
- Returns:
- <-- reference to the gnuplot object
References cmd().
| Gnuplot& gnuplot::Gnuplot::unset_multiplot | ( | ) | [inline] |
unsets the mulitplot mode
- Parameters:
-
---
- Returns:
- <-- reference to the gnuplot object
References cmd().
| Gnuplot& gnuplot::Gnuplot::unset_smooth | ( | ) | [inline] |
unset smooth attention: smooth is not set by default
- Parameters:
-
---
- Returns:
- <-- a reference to a gnuplot object
References smooth.
| Gnuplot& gnuplot::Gnuplot::unset_surface | ( | ) | [inline] |
surface is set by default, it disables the display of surfaces (for 3d plot)
- Parameters:
-
---
- Returns:
- <-- reference to the gnuplot object
References cmd().
| Gnuplot& gnuplot::Gnuplot::unset_title | ( | ) | [inline] |
Clears the title of a gnuplot session The title is not set by default.
- Parameters:
-
---
- Returns:
- <-- reference to the gnuplot object
References set_title().
| Gnuplot& gnuplot::Gnuplot::unset_xlogscale | ( | ) | [inline] |
turns off log scaling for the x axis
- Parameters:
-
---
- Returns:
- <-- reference to the gnuplot object
References cmd().
| Gnuplot& gnuplot::Gnuplot::unset_ylogscale | ( | ) | [inline] |
turns off log scaling for the y axis
- Parameters:
-
---
- Returns:
- <-- reference to the gnuplot object
References cmd().
| Gnuplot& gnuplot::Gnuplot::unset_zlogscale | ( | ) | [inline] |
turns off log scaling for the z axis
- Parameters:
-
---
- Returns:
- <-- reference to the gnuplot object
References cmd().
Member Data Documentation
FILE* gnuplot::Gnuplot::gnucmd [private] |
pointer to the stream that can be used to write to the pipe
Referenced by cmd(), init(), and ~Gnuplot().
std::string gnuplot::Gnuplot::m_sGNUPlotFileName [static, private] |
name of executed GNUPlot file
Referenced by get_program_path(), init(), and set_GNUPlotPath().
std::string gnuplot::Gnuplot::m_sGNUPlotPath [static, private] |
gnuplot path
Referenced by get_program_path(), init(), and set_GNUPlotPath().
int gnuplot::Gnuplot::nplots [private] |
number of plots in session
Referenced by cmd(), init(), plot_equation(), plot_equation3d(), plot_image(), plot_slope(), plotfile_x(), plotfile_xy(), plotfile_xy_err(), plotfile_xyz(), replot(), reset_all(), and reset_plot().
std::string gnuplot::Gnuplot::pstyle [private] |
functions and data are displayed in a defined styles
Referenced by plot_equation(), plot_equation3d(), plot_slope(), plotfile_x(), plotfile_xy(), plotfile_xyz(), reset_all(), and set_style().
std::string gnuplot::Gnuplot::smooth [private] |
interpolate and approximate data in defined styles (e.g. spline)
Referenced by init(), plotfile_x(), plotfile_xy(), reset_all(), set_smooth(), and unset_smooth().
std::string gnuplot::Gnuplot::terminal_std [static, private] |
standart terminal, used by showonscreen
Referenced by set_terminal_std(), and showonscreen().
std::vector<std::string> gnuplot::Gnuplot::tmpfile_list [private] |
list of created tmpfiles
Referenced by create_tmpfile(), and remove_tmpfiles().
int Gnuplot::tmpfile_num = 0 [static, private] |
number of all tmpfiles (number of tmpfiles restricted)
Referenced by create_tmpfile(), and remove_tmpfiles().
bool gnuplot::Gnuplot::two_dim [private] |
true = 2d, false = 3d
Referenced by cmd(), plot_equation(), plot_equation3d(), plot_image(), plot_slope(), plotfile_x(), plotfile_xy(), plotfile_xy_err(), and plotfile_xyz().
bool gnuplot::Gnuplot::valid [private] |
validation of gnuplot session
Referenced by cmd(), init(), and is_valid().
The documentation for this class was generated from the following files:
- external_src/gnu_wrapper/gnuplot_i.hpp
- external_src/gnu_wrapper/gnuplot_i.cpp